If you’re someone who loves installing and testing SaaS platforms, containers, and open-source tools, you’ll quickly end up with a growing list of URLs, ports, and DNS records especially if you’re running your own DNS server. In my case, I use pfSense to manage my homelab DNS.
Managing a homelab dashboard can greatly improve your workflow by giving you quick, organized access to all your self-hosted services. When setting up your dashboard, it’s essential to plan which applications you want to include, as it will act as the central hub for your entire environment.
Every time I come across a new application that catches my attention, I make sure to test it. I use Kubernetes for container-based applications, and Proxmox for anything that’s not containerized.
This is where the magic of Dashy comes in. Dashy helps you organize and access all your self-hosted services from a single place. It’s lightweight, easy to set up, and packed with features that make managing a homelab a lot more efficient.
Some of Dashy’s key features include:
- Support for multiple pages
- Real-time status monitoring for each of your apps/links
- Use widgets to display info and dynamic content from self-hosted services
- Instant search by name, domain, or tags + customizable hotkeys & keyboard shortcuts
- Many built-in color themes, with UI color editor and support for custom CSS
- Many icon options – Font-Awesome, homelab icons, auto-fetching Favicon, images, emojis, etc.
- Optional authentication with multi-user access, configurable privileges, and SSO support
- Multi-language support, with 10+ human-translated languages, and more on the way
- Optional, encrypted, free off-site cloud backup and restore feature available
- A workspace view, for easily switching between multiple apps simultaneously
- A minimal view, for use as a fast-loading browser Startpage
- Choose app launch methods: new tab, same tab, clipboard, pop-up modal, or open in workspace view
- Customizable layout, sizes, text, component visibility, sort order, behavior, etc.
- Options for a full-screen background image, custom nav-bar links, HTML footer, title, etc.
- Easy to setup with Docker, or on bare metal, or with 1-Click cloud deployment
- Easy single-file YAML-based configuration, and option to configure app through the UI
- Under active development with improvements and new features added regularly
- Small bundle size, fully responsive UI, and PWA for basic offline access
- 100% free and open-source
- Strong focus on privacy
Demo Homelab Dashboard
Live Instances: Demo 1 (Live Demo) ┆ Demo 2 (Dashy Links) ┆ Demo 3 (Dev Preview)
Creating an Effective Homelab Dashboard
Since I mainly use one device (my laptop) to access my network, I decided to run Dashy locally using Docker. Deployment is straightforward:
docker run -d -p 8080:8080 -v ~/my-local-conf.yml:/app/user-data/conf.yml --name my-dashboard --restart=always lissy93/dashy:latestThe important part is mounting your configuration file correctly. You can name it anything you like, but it must be mounted to /app/user-data/conf.yml inside the container.
Here’s a quick example of a simple my-local-conf.yml file:
pageInfo:
  title: Home Lab Demo
  navLinks: []
  footerText: '© 2025 Demo Home Lab'
sections:
  - name: Infrastructure
    icon: fas fa-network-wired
    items:
      - title: pfSense
        description: Firewall & Router
        icon: fas fa-shield-alt
        url: http://pfsense.example.com
        id: 0_1505_pfsense
        statusCheckAllowInsecure: true
      - title: Proxmox Node 1
        description: Virtualization Host
        icon: fas fa-server
        url: https://pve1.example.com:8006
        id: 1_1505_proxmoxnode
        statusCheckAllowInsecure: true
      - title: Proxmox Node 2
        description: Virtualization Host
        icon: fas fa-server
        url: https://pve2.example.com:8006
        id: 2_1505_proxmoxnode
        statusCheckAllowInsecure: true
      - title: NAS
        description: Network Attached Storage
        icon: fas fa-hdd
        url: http://nas.example.com
        id: 3_1505_nas

  - name: Monitoring & Observability
    icon: fas fa-chart-line
    items:
      - title: CheckMK
        description: Monitoring System
        icon: fas fa-heartbeat
        url: http://checkmk.example.com/homelab
        id: 0_2539_checkmk
      - title: Grafana
        description: Dashboards & Metrics
        icon: fas fa-chart-pie
        url: http://grafana.example.com
        id: 1_2539_grafana
      - title: InfluxDB
        description: Time Series Database
        icon: fas fa-database
        url: http://influxdb.example.com
        id: 2_2539_influxdb

  - name: DevOps & CI/CD
    icon: fas fa-tools
    items:
      - title: Jenkins
        description: Automation & CI/CD
        icon: fas fa-cogs
        url: http://jenkins.example.com
        id: 0_1017_jenkins
      - title: Kubernetes
        description: K8s Dashboard
        icon: fas fa-cubes
        url: http://k8s.example.com
        id: 1_1017_kubernetes

appConfig:
  theme: cherry-blossom
  layout: auto
  iconSize: large
  statusCheck: true
With a well-organized homelab dashboard, you can easily monitor, access, and manage all your applications in one place. Customizing your layout not only improves usability but also gives your dashboard a personal touch.
Once the container starts, Dashy automatically serves your new dashboard on port 8080, creating a beautiful central interface for all your tools.
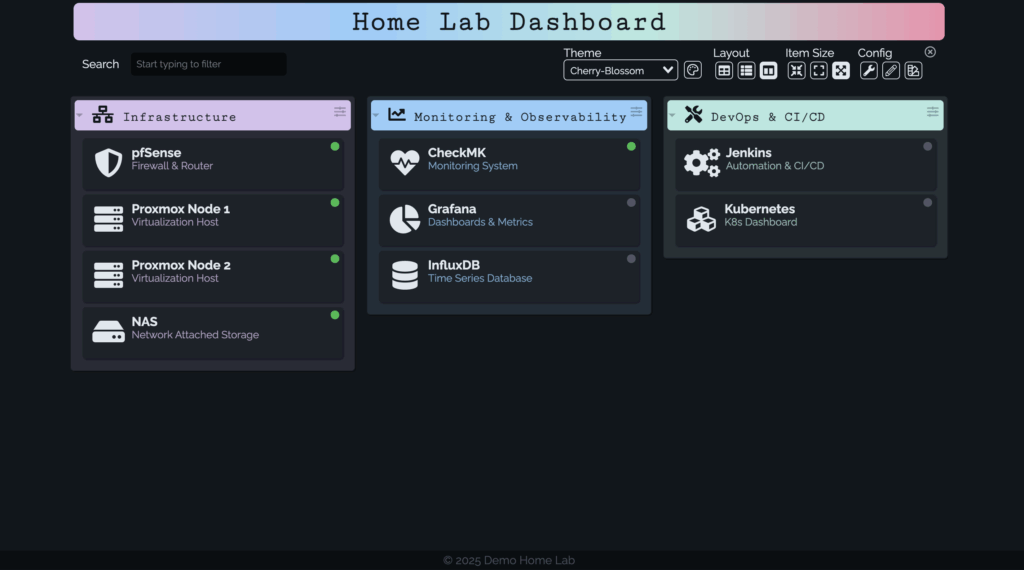
Dashy makes it easy to centralize all your self-hosted applications by setting up a homelab dashboard. A clean and organized interface can be created by deploying Dashy with Docker and a single YAML configuration file to improve your workflow, save time, and keep your services easily accessible.
Whether you’re using Kubernetes, Proxmox, or testing new SaaS tools, Dashy gives you the freedom to manage how you view and interact with your environment. With its rich set of features, customization, and ease of deployment, it’s one of the best solutions for anyone serious about homelab organization.
For more articles on topics check out Let’s Talk About DevOps.